Table Of Contents
This article is the result of an exercise for the subject Mining of Social Media in the Master’s Degree in Data Science at the UGR
Network analysis
This network contains a subset of the followers of the Twitter account @elbaulp, since due to API limitations the download of the network up to the second degree of connection took a long time.
The objective of this analysis is to identify the most influential actors, who act as a bridge between communities in order to expand the number of followers of @ElbaulP.
Average degree
- N = 2132 nodes.
- L = 6643 links
- Density = 0.001
- Average grade = 3.116, which means that each node of the network is connected to another 3 on average.
The density graphs of the degrees are shown below.
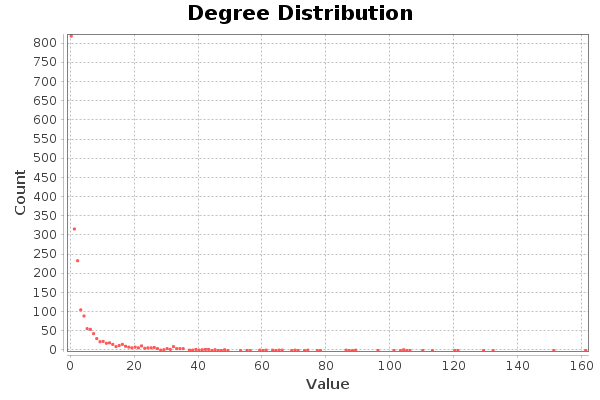
In terms of total grades, there are four nodes that stand out, with a grade greater than 120. The node with the highest grade is 161. These nodes correspond to hubs. The distribution of degrees indicates that the property is fulfilled free of scale. Very few with many connections, and many with few connections.
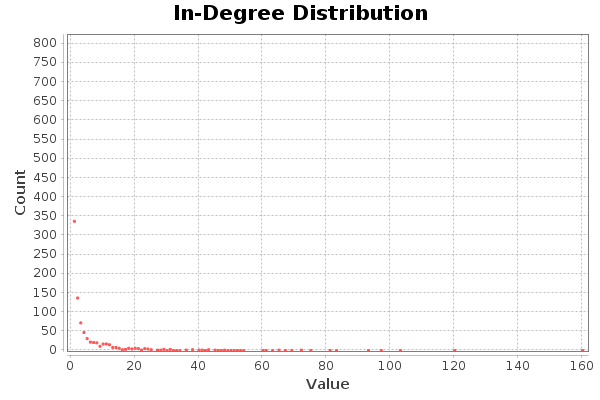
The nodes with the highest degree of input (with the highest number of followers) have 120 and 160 followers, respectively.
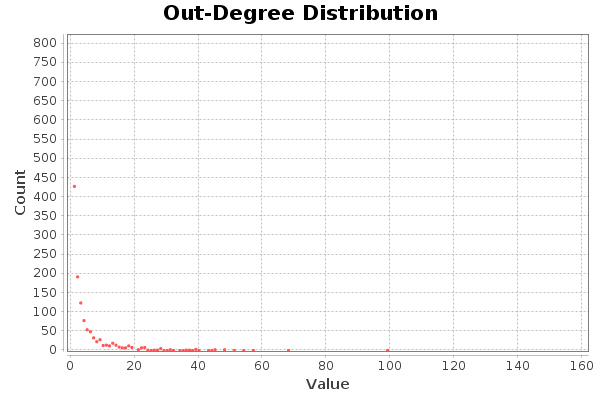
It is absolutely the same for the degrees of entry and exit, in the case of Twitter this indicates followers and followers. The user with more friends has about 99 friends.
Diameter
The diameter of the network is 13. This value represents the maximum distance between two nodes in the entire network. The average distance is 4.5.
The distance histogram is as follows:
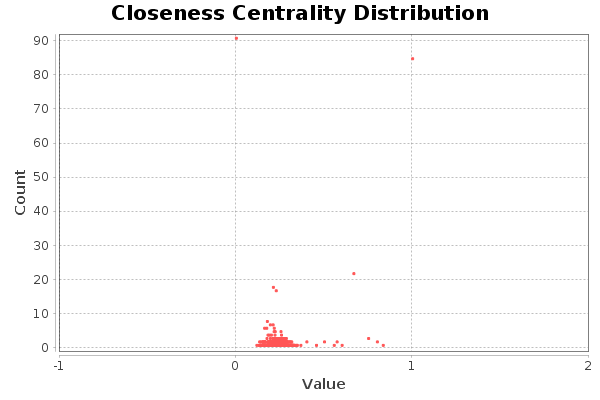
The closeness diagram shows that there are quite a few nodes very far from the centre (around 90). Others, on the other hand, are very located in the centre of the network (about 85). The rest of the nodes are located around the centre of the network.
Connectivity
There are 845 related components, the giant component groups 1261 nodes. The average clustering coefficient is 0.068. In this case it is low, since the twitter account is a blog account, rather than a personal account. The CC histogram is as follows:

This indicates that in sparsely populated regions the clustering coefficient is very high, as the nodes are more locally connected to each other. For this reason, a very high point stands out at the beginning of the graph.
Betweeness Centrality
The first five actors for the following measures are:
| Centralidad de Grado | Intermediación | Cercanía | Vector propio |
|---|---|---|---|
| nixcraft: 161 | rootjaeger: 0.048 | programador4web: 1 | Makova_: 1 |
| Makova_: 151 | podcastlinux: 0.048 | KevinhoMorales: 1 | psicobyte_: 0.966 |
| cenatic: 132 | Linuxneitor: 0.043 | elrne: 1 | Terceranexus6: 0.908 |
| Terceranexus6: 129 | Makova_: 0.039 | Mrcoo16: 1 | NuriaStatgirl: 0.796 |
| LignuxSocial: 121 | Wdesarrollador: 0.038 | RodriKing14: 1 | Inter_ferencias: 0.780 |
As for the grade centrality, it is not very much taken into account, although it reflects the number of connections of an actor, it does not take into account the overall structure of the network.
An important measure is intermediation, these actors act as a bridge between other regions of the network. So they can connect different communities to each other. In the case at hand (Twitter), if we get one of these actors to mention us or do RT, our tweet could reach other types of users who might be interested in our ideas.
The closeness measures how close an actor is to the center of the network. In this case it doesn’t help us much, since all the nodes have the same measure.
Finally, the own vector core is a recursive measure that assigns importance to a node according to the importance of its neighbors. That is, it takes into account the quality of connections, rather than quantity. The first actor has a value of this measure of 1, which indicates that it is the most important node and with the greatest number of important connections. It is then an actor to be taken into account in the network.
Community detection
For the detection of communities, a resolution factor of 1.99 has been used to obtain a total of 5 communities. This resolution value was chosen because lower values resulted in a greater number of communities, but many of them formed by two nodes. The value for modularity is 0.436, which is a good value.
The proportion of nodes in each community is as follows:
- 40.85%
- 21.39%
- 17.5%
- 10.98%
- 9.15%
- 0.14%
The modularity distribution can be seen in the following image:

All are reasonably sized except one, which is too small.
The following image shows the colored graph according to which community belongs to each node:
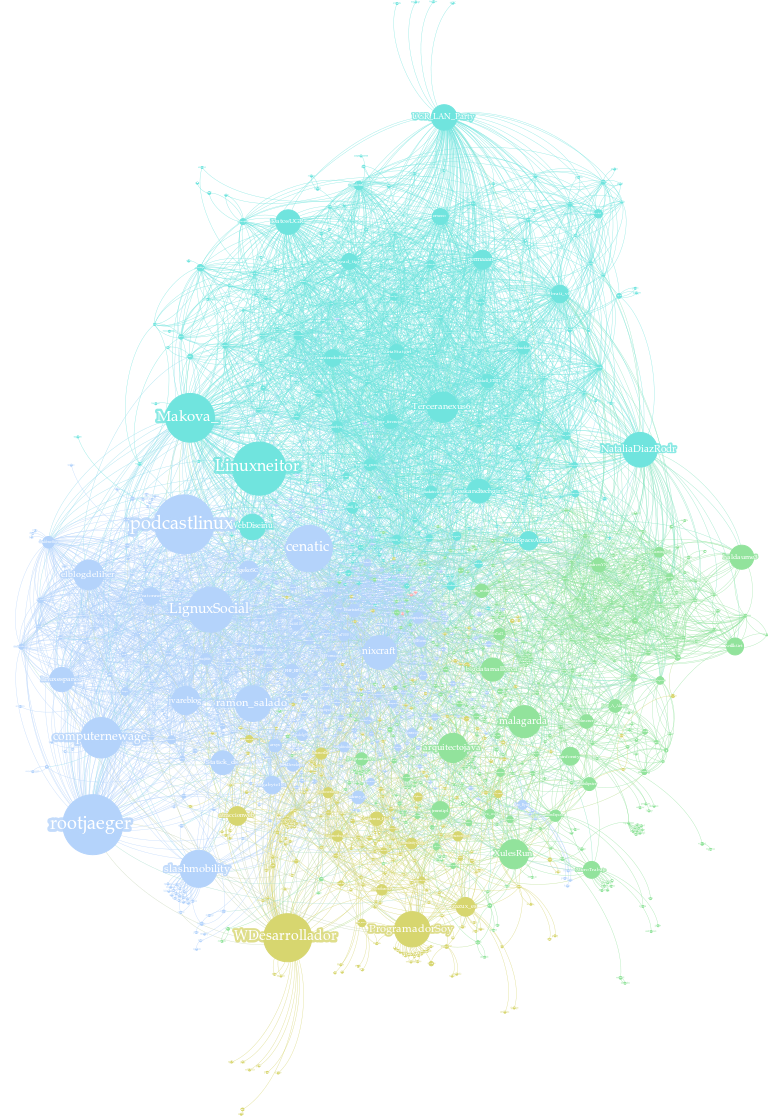
Analyzing the network, it can be seen that the community above (sky blue) belongs to nodes related to ETSIIT. Some members of this community act as a bridge (they are nodes with a lot of intermediation) with other communities. For example, Makova_ and Linuxneitor bridge with the purple community, this community is more related to Linux users and Linux blogs. NataliaDiazRodrz bridges the ETSIIT community with the green community, more related to the Data Science theme. This makes sense, since NataliaDiazRodrz studied at ETSIIT and works in Data Science, specifically in NLP topics. The Amarilla community is related to programming.
Additional plots
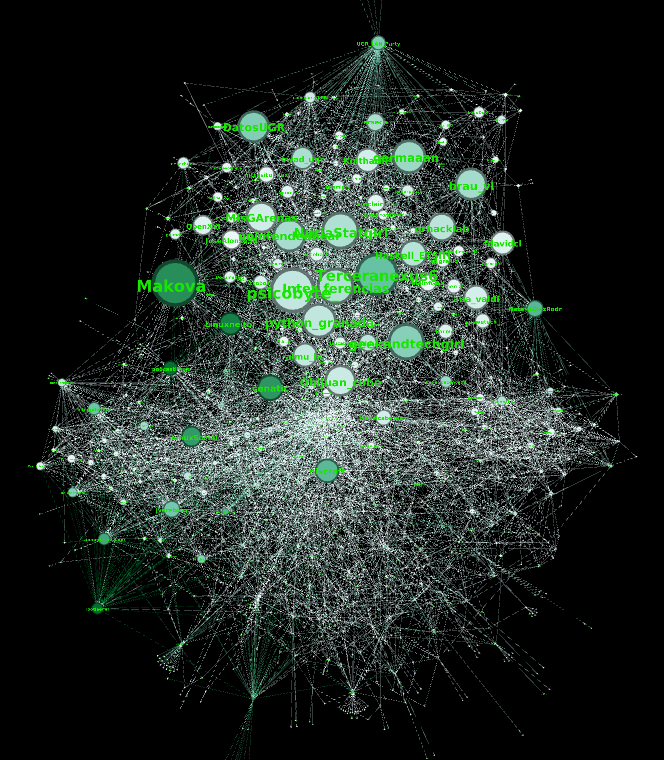
The following graph shows the network arranged with the colors according to the value of the vector itself, and the size of the nodes as the intermediation:

In the following figure the inverse is shown, color the intermediation, size the own vector:
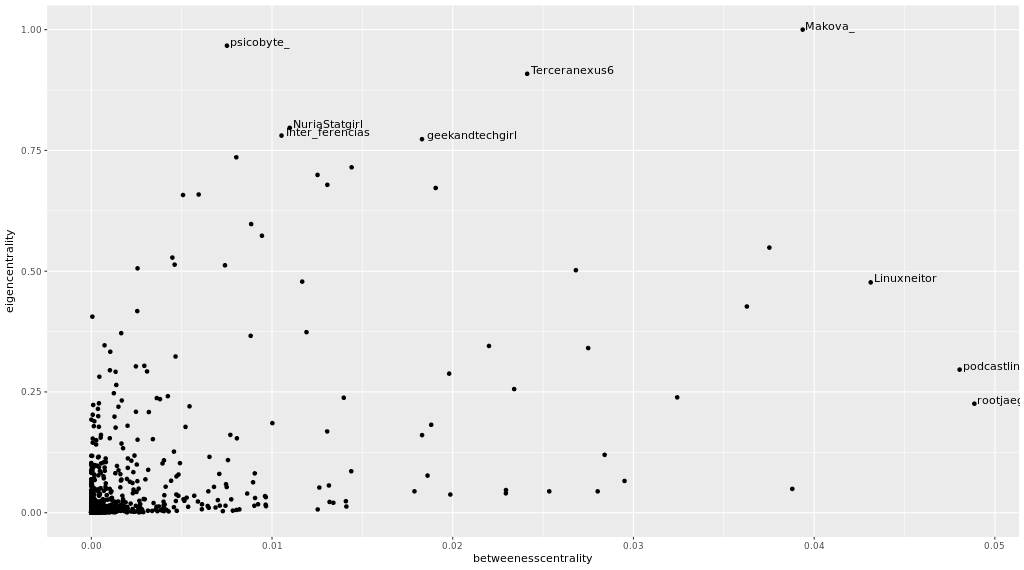
I consider that the most important measures are the own vector value and the intermediation, the following graphic shows how they are related between them. The higher the value for both the better, the more important the node:
Spot a typo?: Help me fix it by contacting me or commenting below!